Comprehensive & Enhanced Wildfire Dataset
The CinderSight project utilizes an enriched version of the Next Day Wildfire Spread (NDWS) dataset, expanding from 12 to 19 features for comprehensive wildfire modeling.
The enhanced dataset spans from July 2015 to October 2024, covering 39,333 samples across the contiguous United States at 1 km spatial resolution. It incorporates next-day weather forecasts and terrain features to provide substantial detail for wildfire spread modeling.
Download the full enriched NDWS dataset here.
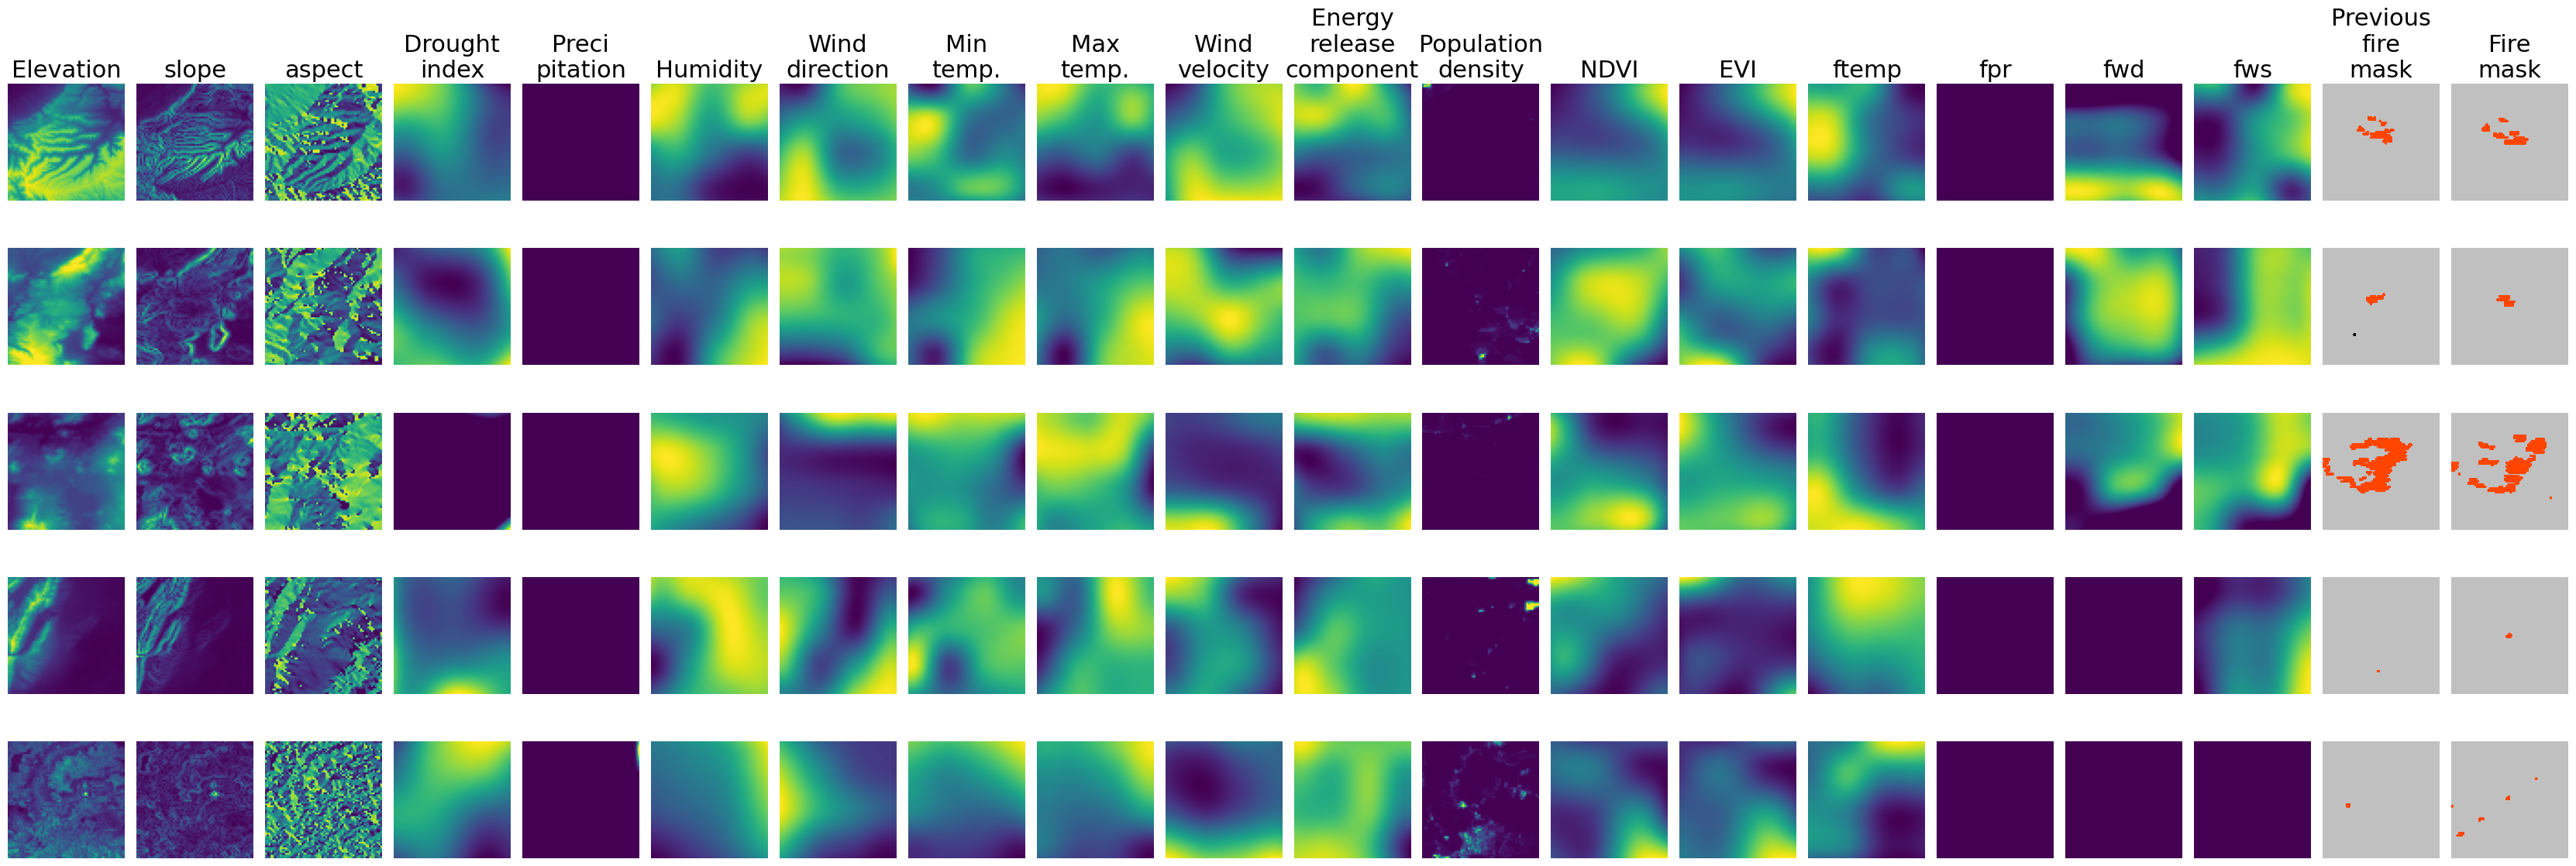
Sample Feature & Mask Grid
A quick glance at all input features plus fire masks.
Enhanced Dataset Features (19 Total)
Comprehensive environmental, meteorological, and anthropogenic factors
Weather Factors (Current Day) - 8 Features
• Wind Speed (vs): Daily wind speed in m/s from GRIDMET (4 km resolution)
• Precipitation (pr): Daily precipitation in mm/day from GRIDMET (4 km resolution)
• Specific Humidity (sph): Daily specific humidity in kg/kg from GRIDMET (4 km resolution)
• Max Temperature (tmmx): Daily maximum temperature in °C from GRIDMET (4 km resolution)
• Min Temperature (tmmn): Daily minimum temperature in °C from GRIDMET (4 km resolution)
• Wind Direction (th): Daily wind direction in degrees from GRIDMET (4 km resolution)
• Energy Release Component (erc): Daily ERC from NFDRS (1 km resolution)
• Drought Index (pdsi): Palmer Drought Severity Index from GRIDMET (4 km resolution)
Weather Forecast (Next Day) - 4 Features
• Forecast Temperature (ftemp): Next-day temperature forecast in °C from NOAA GFS (27.83 km resolution)
• Forecast Precipitation (fpr): Next-day precipitation forecast in mm/day from NOAA GFS (27.83 km resolution)
• Forecast Wind Speed (fws): Next-day wind speed forecast in m/s from NOAA GFS (27.83 km resolution)
• Forecast Wind Direction (fwd): Next-day wind direction forecast in degrees from NOAA GFS (27.83 km resolution)
Terrain Factors - 3 Features
• Elevation: Terrain elevation in meters from SRTM (30 m resolution, downsampled to 1 km)
• Aspect: Terrain aspect in degrees from SRTM (30 m resolution, downsampled to 1 km)
• Slope: Terrain slope in degrees from SRTM (30 m resolution, downsampled to 1 km)
Vegetation & Human Factors - 3 Features
• NDVI: Normalized Difference Vegetation Index from VIIRS (500 m resolution, downsampled to 1 km)
• EVI: Enhanced Vegetation Index from VIIRS (500 m resolution, downsampled to 1 km)
• Population Density: Population density in people/km² from GPWv4 (927.67 m resolution, downsampled to 1 km)
Data Processing Pipeline
Comprehensive preprocessing steps for high-quality model inputs
Spatial & Temporal Alignment
• Spatial Resolution: All data aligned to 1 km resolution to match fire mask resolution
• Topography & Vegetation: Downsampled using bicubic interpolation
• Weather & Drought: Upsampled using bicubic interpolation
• Temporal Alignment: Hourly forecasts aggregated to daily means
• Vegetation Composites: 16-day composites linearly interpolated to daily values
Data Augmentation & Spatial Processing
• Value Clipping: Features clipped to remove extreme values (0.1st to 99.9th percentiles)
• Normalization: Mean and standard deviation normalization from training dataset
• Random Cropping: 32×32 km regions randomly cropped from 64×64 km regions
• Rotation: Each sample rotated by 0°, 90°, 180°, and 270° for data variability
• Center Cropping: Focused analysis since fires are generally centered
• Spatial Context Processing: Each pixel's 19 features are expanded to 171 features by incorporating surrounding 8 neighboring pixels (9 total positions × 19 features = 171 channels)
• Surrounding Position Function: Creates spatial context by concatenating center pixel with up, down, left, right, and diagonal neighbors
Dataset Statistics
Key metrics and distribution information
39,333
Total Samples
1 km
Spatial Resolution
64×64
Input Resolution (pixels)
2015-2024
Temporal Coverage
Class Distribution
1.34%
Fire Pixels
97.81%
No-Fire Pixels
0.85%
Unlabeled Pixels
Feature Statistics
Statistical summary of all 19 features after preprocessing
| Feature | Mean | Std | Min | Max |
|---|---|---|---|---|
| Wind Speed (vs) | 3.529 | 0.886 | 1.521 | 6.660 |
| Precipitation (pr) | 0.206 | 1.095 | -0.163 | 17.820 |
| Specific Humidity (sph) | 0.006 | 0.003 | 0.002 | 0.014 |
| Max Temperature (tmmx) | 299.411 | 6.743 | 280.763 | 311.845 |
| Min Temperature (tmmn) | 282.481 | 6.785 | 267.686 | 295.878 |
| Wind Direction (th) | 229.476 | 76.533 | 24.903 | 339.065 |
| Energy Release Component (erc) | 55.302 | 26.148 | 10.002 | 103.569 |
| Drought Index (pdsi) | -0.113 | 3.063 | -7.003 | 8.182 |
| Forecast Temperature (ftemp) | 24.102 | 5.379 | 8.118 | 35.256 |
| Forecast Precipitation (fpr) | 0.007 | 0.002 | 0.002 | 0.017 |
| Forecast Wind Speed (fws) | -0.145 | 2.860 | -6.521 | 7.361 |
| Forecast Wind Direction (fwd) | 2.647 | 3.084 | -4.446 | 13.176 |
| Elevation | 959.124 | 901.733 | 0.000 | 4054.000 |
| Aspect | 169.162 | 96.550 | 0.000 | 359.850 |
| Slope | 2.694 | 3.766 | 0.000 | 35.420 |
| NDVI | 4926.497 | 1438.924 | 1809.648 | 8463.683 |
| EVI | 2731.871 | 784.070 | 1233.121 | 5540.832 |
| Population Density | 13.811 | 103.098 | 0.000 | 5283.745 |
Feature Correlation Matrix
Pearson correlation coefficients between all 19 features
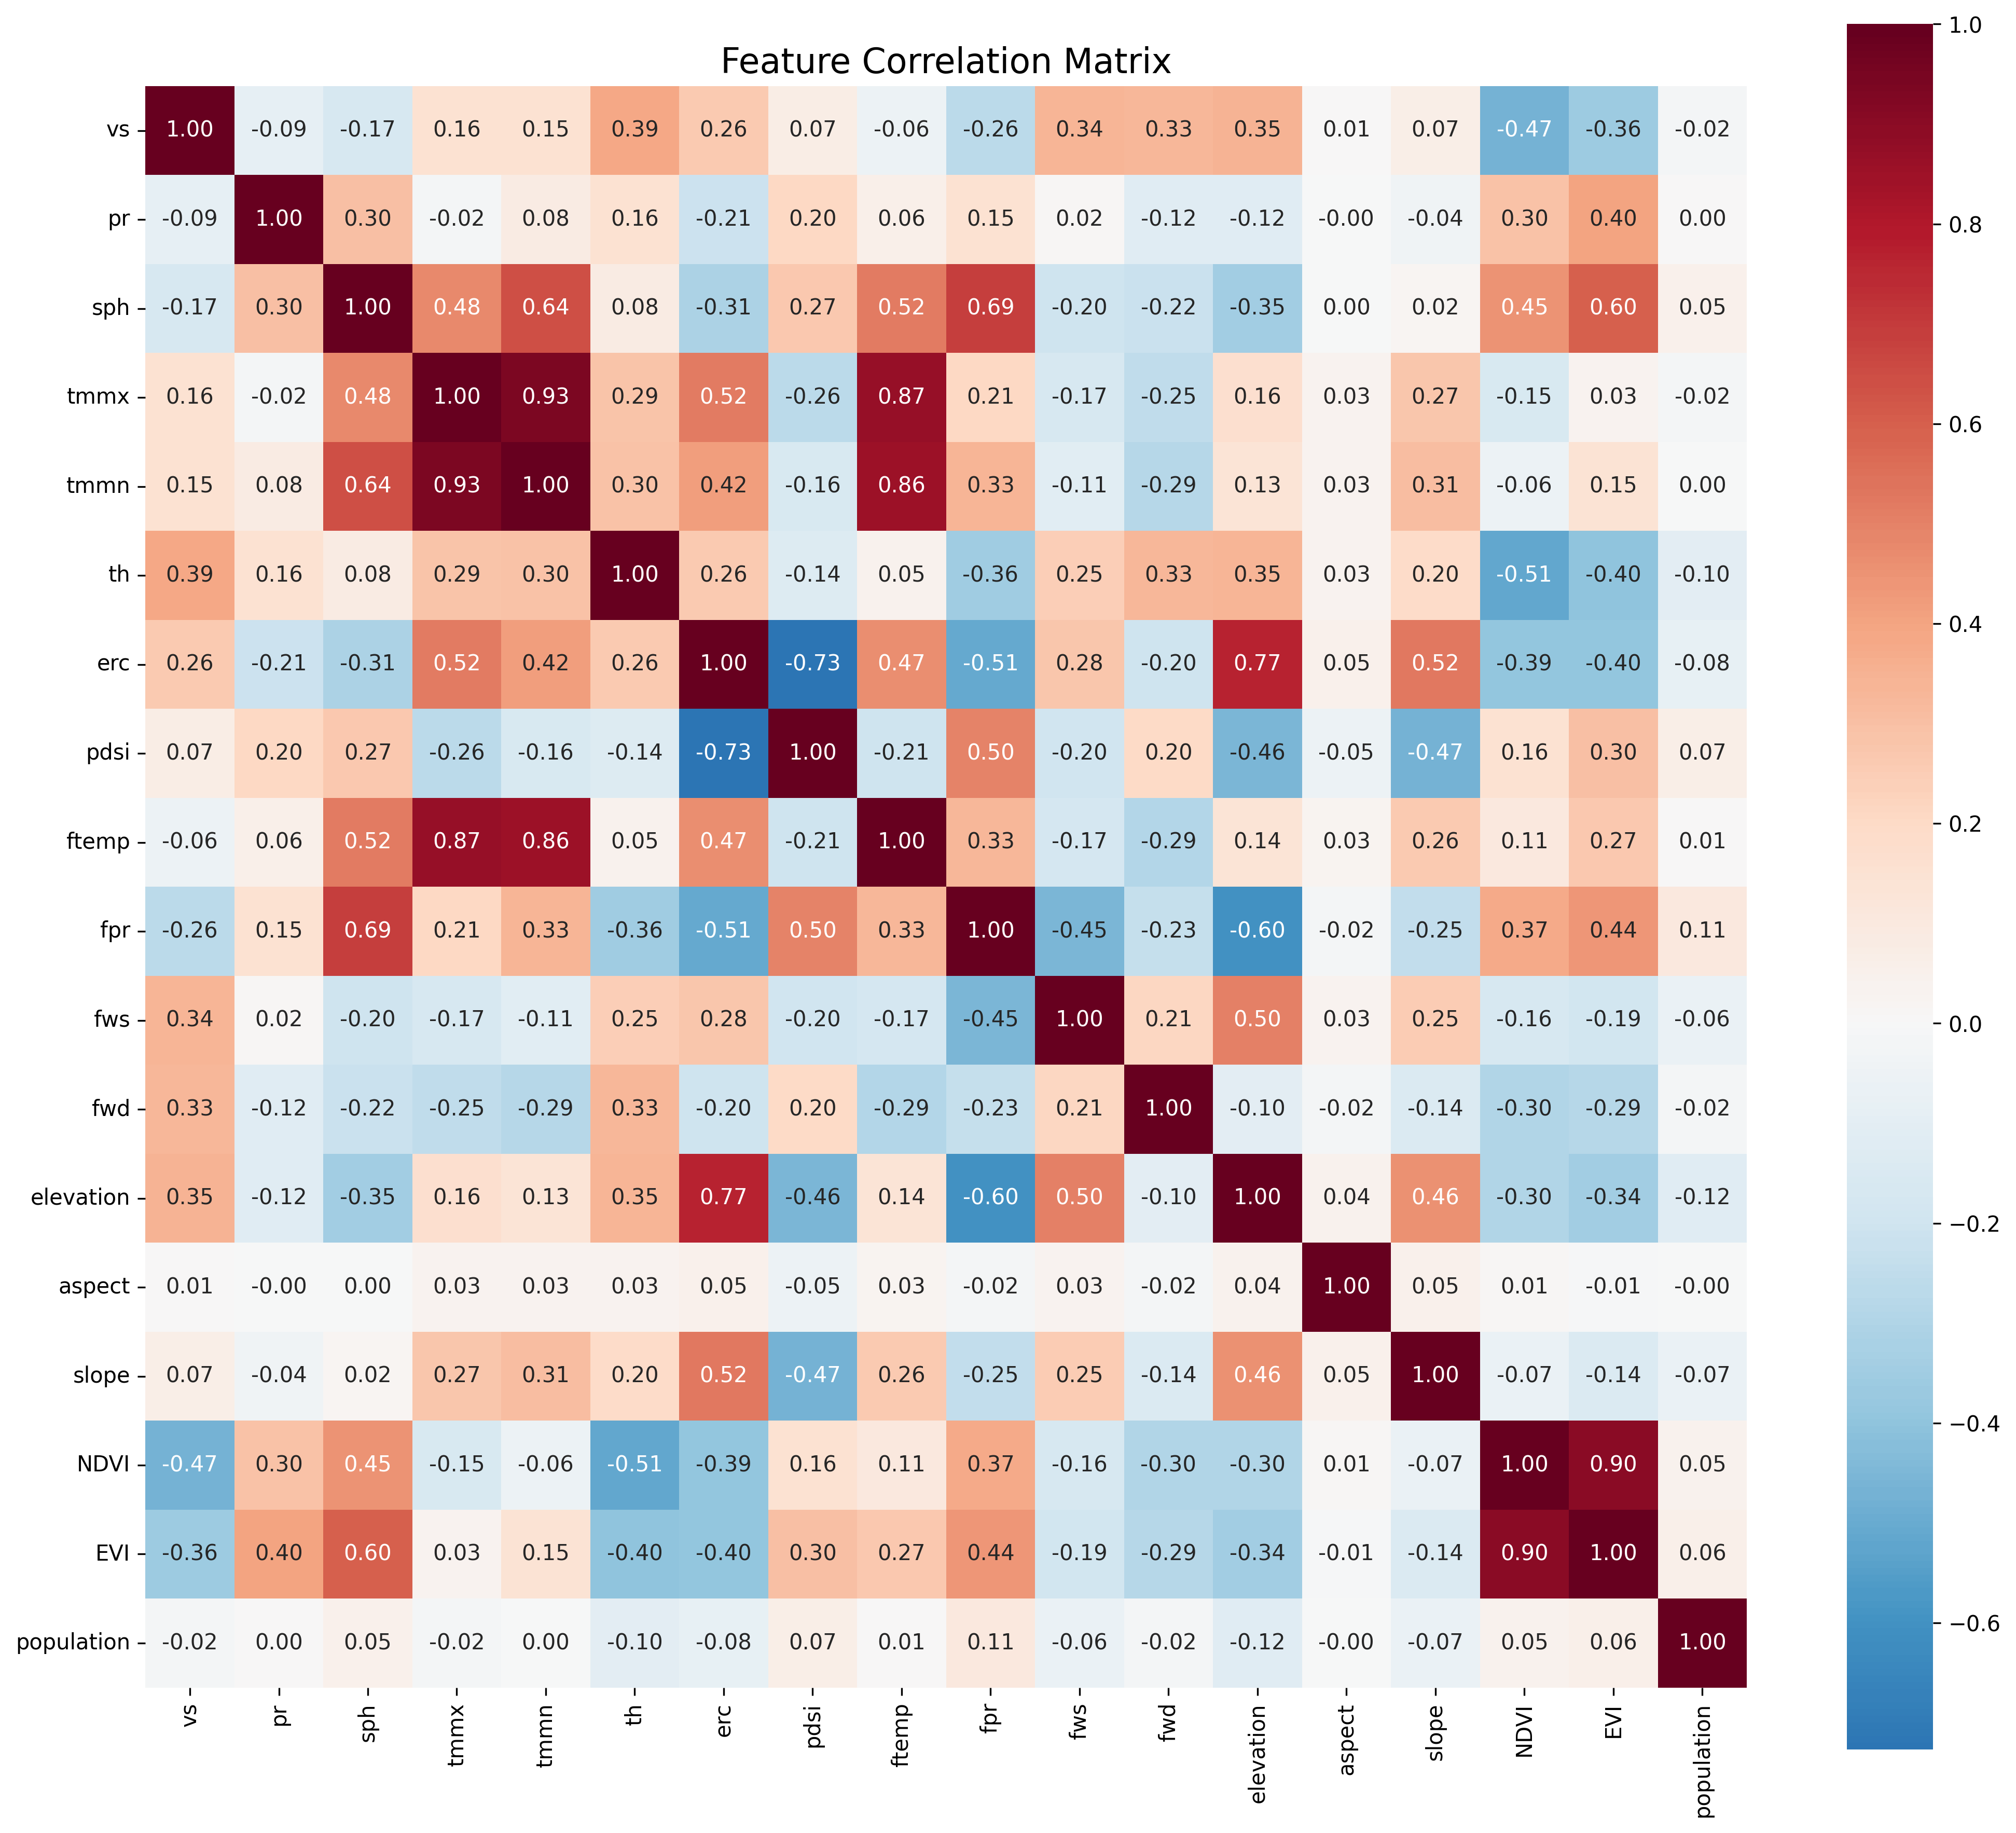
Key Correlations:
- • Temperature Correlation: Max and min temperatures show very high correlation (0.93)
- • Vegetation Indices: NDVI and EVI are highly correlated (0.90) as both measure vegetation greenness
- • Drought & Energy: PDSI and ERC show strong negative correlation (-0.73), indicating drought increases fire risk
- • Elevation & Fire Risk: Elevation and ERC show strong positive correlation (0.77)
- • Weather Forecasts: Forecast temperature strongly correlates with current temperatures (0.87)